C-M Analysis
C-M Analysis
The C-M graph is a graph in which two grain size parameters, C value and M value, are used as horizontal and vertical logarithmic coordinates respectively. The C value is the grain size corresponding to 1% of the cumulative curve, and the M value is the grain size corresponding to 50% of the cumulative curve. The C-M graph represents the relationship between the coarsest grain size and the median grain size of the sediment.
According to the comparison between the obtained graph and the typical C-M graph of the known depositional environment, the depositional environment of this layer of sedimentary rock can be evaluated.
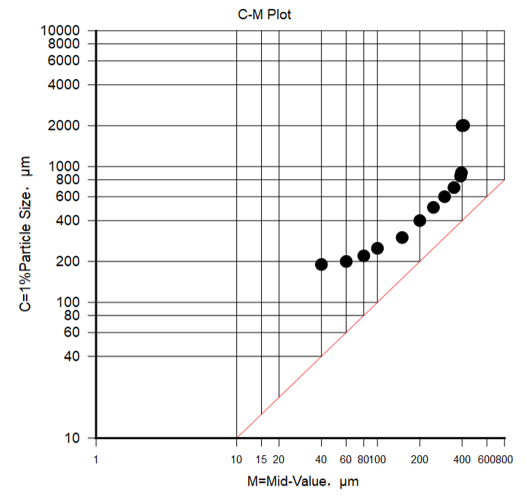
Fig. An example of C-M graph
Steps to perform C-M Analysis in GES:
· Go to Geological Evaluation scenario/Geology & Modeling Scenario → Geology Evaluation → CM Analysis
· Select a well → Click OK
Message