Production Map
Production Map
Production map utilizes bubble map or bar chart to display production data on a map. It is usually shown with property maps such as net pay map and isochore map to provide an independent verification of any geological evaluation. GES provide two different production maps, bubble map and bar chart.
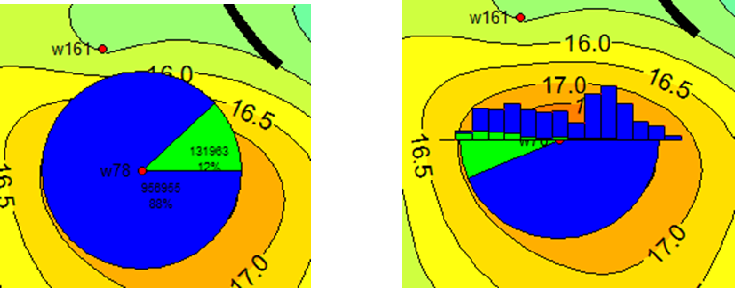
Fig. Production curve of well w135
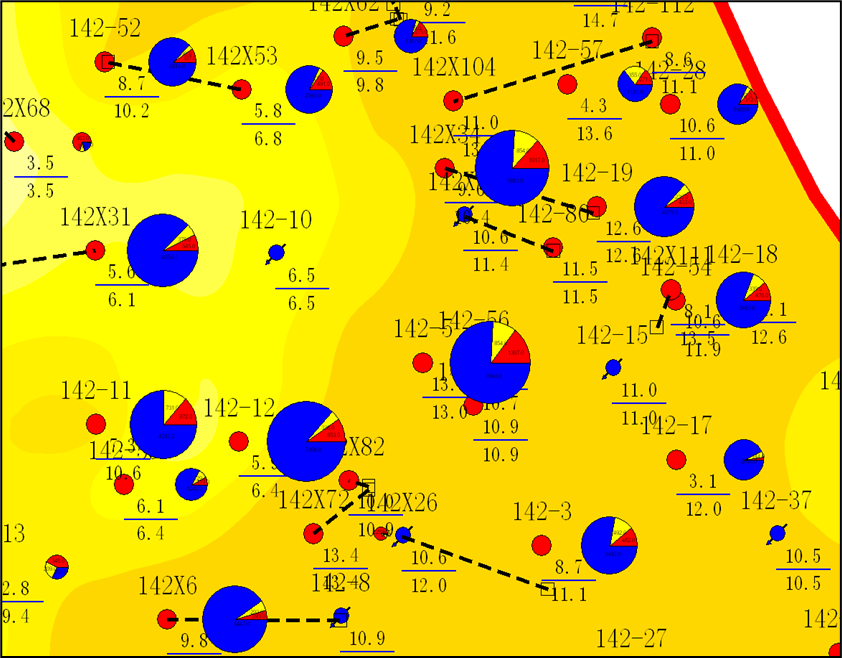
Fig. Bubble map overlay with sand map
Steps to perform Production Map in GES:
· Go to Geological Evaluation scenario/Geology & Modeling Scenario → Geology Evaluation → Production Map
· Input Map name → Check Bubble Map or Bar Chart → Select data for Data Fields → Select Well → Set Start Date and End Date → Click OK
Message