Structure Map
Structure Map
Structure map presents structural information on a map. In GES, you can create a structure map by using well picks data, line data or points data. You can control the structure trend by using trend surface and contour line, there are 5 algorithms you can choose from when creating a map.
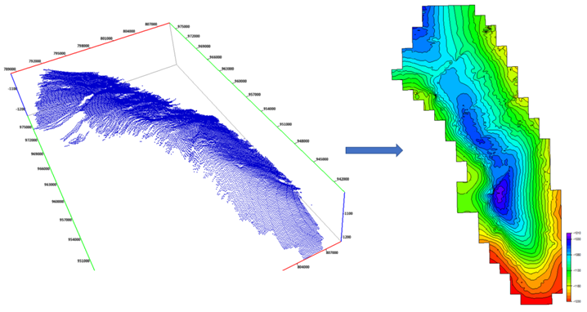
Fig. An example of using point data to create a structure map
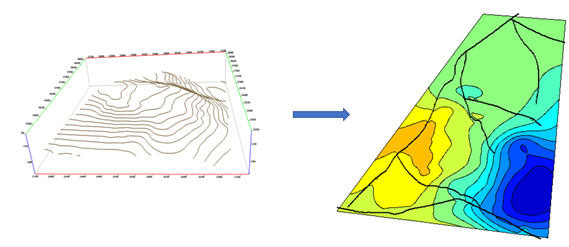
Fig. An example of using line data to create structure map
Steps to perform Structure Map in GES:
· Go to Geological Evaluation Scenario/Geology & Modeling Scenario → Geology Evaluation → Structure Map
· Select Input data, Constrain and Boundary, enter the Output name in Common label
· Set Grid Increment → Select Algorithm in Mapping Settings Label
· Go to Visual Settings label, click Estimate button, Min and Max value will be automatically generated, you can also input the value manually
· Set Interval and click Apply
· Choose the template for Color table
· Set Contour Line Nodes, normally set to 2 → Click OK
· Go to Scene pane, click structure, the contour ribbon bar will be shown, and you can edit contour line and fill in this ribbon bar
Message