Well Correlation
Well Correlation
Well Correlation enables users to interpret geological features from well logs and correlate similar features among multiple wells. It provides a cross-sectional view of key formations, and you can flatten surface on depth or horizon, multiple sets of horizons can be displayed simultaneously.
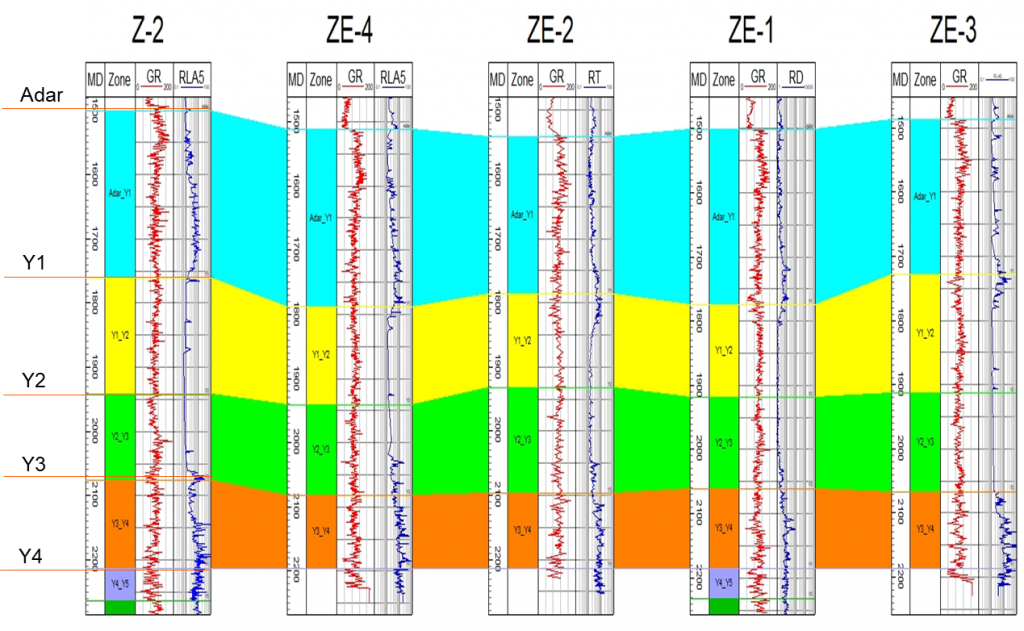
Fig. An example of well correlation in GES
Steps to perform Well Correlation in GES:
· Go to Geological Evaluation Scenario/Geology & Modeling Scenario → Geology Evaluation → Well Correlation
· Choose Create Cross Section Line → Click Select well → Click OK
· Set Vertical Scale, Horizontal Scale and Depth Range
· Click Flatten Mode to select flatten mode
· Click Add Track to add well logs and discrete log etc. → Click well logs column in window → Go to Property pane → Select Data Name in Basic Label
· Go to Well picks Editing Ribbon → Select stratigraphy scheme and surface → Active Edit →left click and drag the selected surface to change surface depth
· Click Ghost Curve → left click on the well logs track and drag the depth interval, the interval will be duplicated → Move this duplicated curve between wells to help user to contrast curve more clearly
Message