GES Modules
Facies Analysis
Facies analysis is a critical step in geological analysis. A reasonable facies description provides essential information for reservoir property distribution. GES provide core facies, including grain size analysis, mineral analysis and CM analysis, to analysis facies form the core, which will help users understand sedimentary environment. And provide log facies and facies map to analysis facies in vertically, in horizontally and in plane.
Grain Size Analysis
Grain size analysis is used to understand sedimentary facies, provenance, and source. GES uses grain size data to analyze phi value, sorting, skewness and kurtosis.
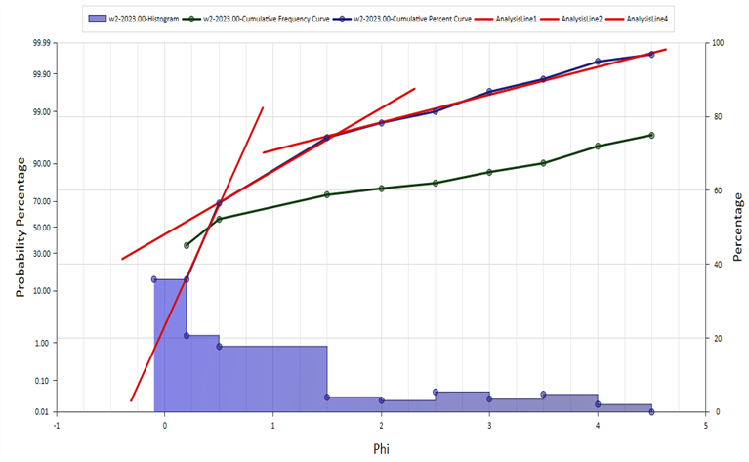
Fig. Probability percentage histogram
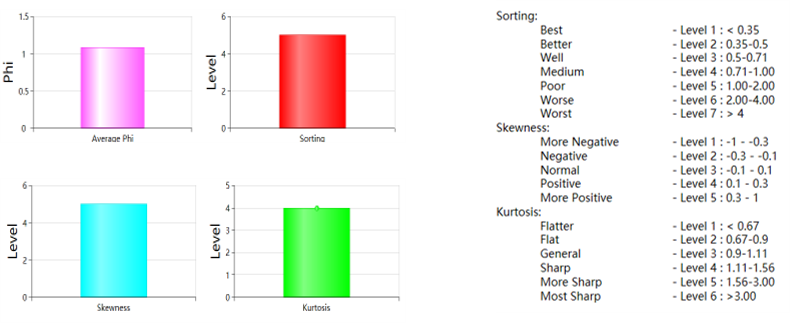
Fig. Average value histogram and legend
Steps to perform Grain Size Analysis in GES:
· Go to Geological Evaluation scenario/Geology & Modeling Scenario → Geology Evaluation → Grain Size Analysis
· Select a well → Input Diagram Name → Set Depth → Click OK
Mineral Analysis
By compositional analysis of feldspar, quartz and rock debris, rock type can be determined. GES provides sedimentary rock common triangular template for feldspar, quartz and rock debris. After importing mineral data, triangular map can be generated in Mineral analysis module.
In addition, the 3-terminal element of the template can be edited as well, and you can define your own template according to different situations.
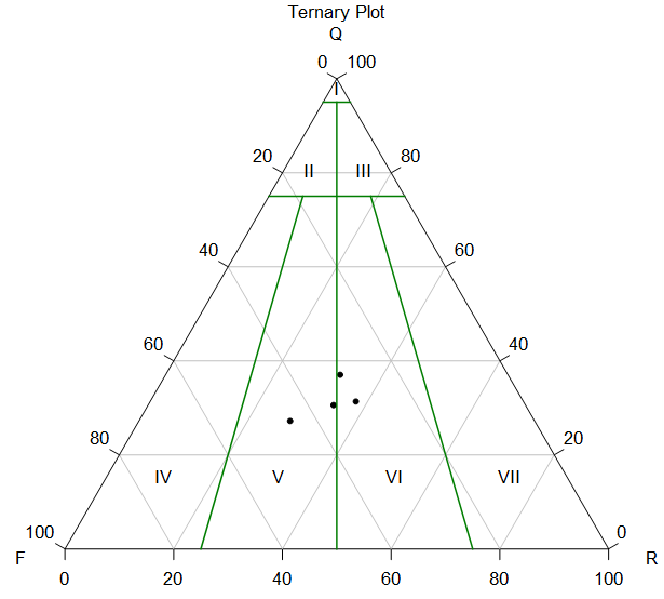
Fig. Probability percentage histogram
Steps to perform Mineral Analysis in GES:
· Go to Geological Evaluation scenario/Geology & Modeling Scenario → Geology Evaluation → Mineral Analysis
· Select a well → Click OK
C-M Analysis
The C-M graph is a graph in which two grain size parameters, C value and M value, are used as horizontal and vertical logarithmic coordinates respectively. The C value is the grain size corresponding to 1% of the cumulative curve, and the M value is the grain size corresponding to 50% of the cumulative curve. The C-M graph represents the relationship between the coarsest grain size and the median grain size of the sediment.
According to the comparison between the obtained graph and the typical C-M graph of the known depositional environment, the depositional environment of this layer of sedimentary rock can be evaluated.
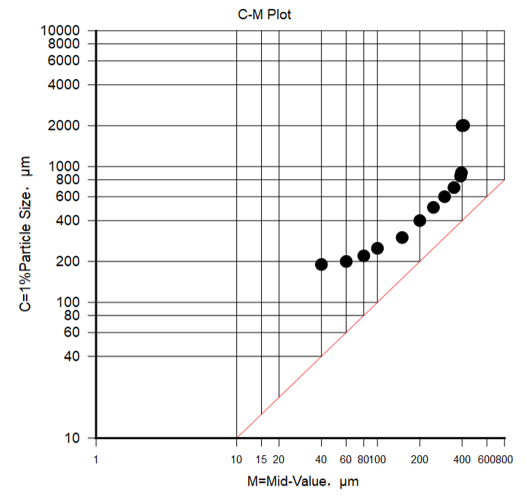
Fig. An example of C-M graph
Steps to perform C-M Analysis in GES:
· Go to Geological Evaluation scenario/Geology & Modeling Scenario → Geology Evaluation → CM Analysis
· Select a well → Click OK
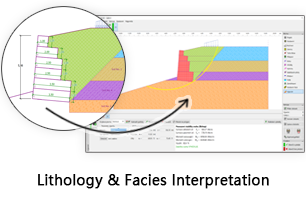
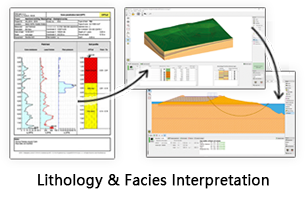
Facies Interpretation
Facies Interpretation is used to analyze facies vertically. Normally you can get facies result according to GR curve shape. GES provide facies edit template, stratum track, well logs track, discrete track, core image track can be added to well column. Discrete logs (lithology and facies) in GES can be displayed by color, by style, and the width ratio can be adjusted.
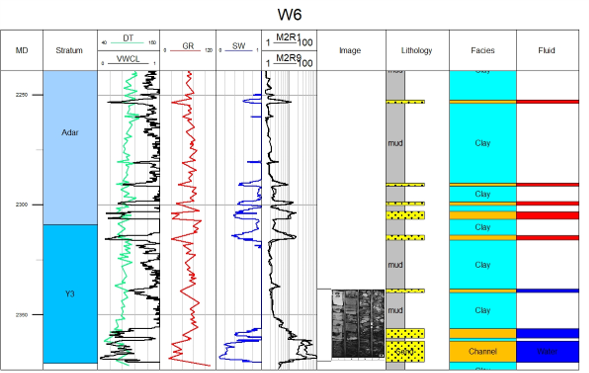
Fig. Individual facies map of W6
Steps to perform Facies Interpretation in GES:
· Go to Geological Evaluation scenario/Geology & Modeling Scenario → Geology Evaluation → Facies Interpretation
· Select a well → Select stratigraphy scheme for well picks → Choose Top/Bottom Horizon → Select a well template → Click OK
· Click well column → Right click → Add well track you want to display
· Click discrete log track header, discrete attribute can be edit by using Discrete Logs Editing ribbon bar
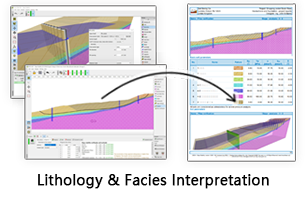
Facies Map
Facies Map can show us facies distribution in a plane. In GES, you can perform facies map manually or automatically.
When generating facies map automatically, GES adopts an intelligent mapping algorithm, patented by GPT Software. The algorithm has 4 steps:
1. Create main line according to source direction.
2. Create auxiliary line according to channel length-to-width ratio.
3. Use main line and auxiliary line to create facies boundary.
4. Repeat until all facies boundaries have been created.
Facies priority sequence can be set to make sure the main facies distribution will not be affected by other facies.
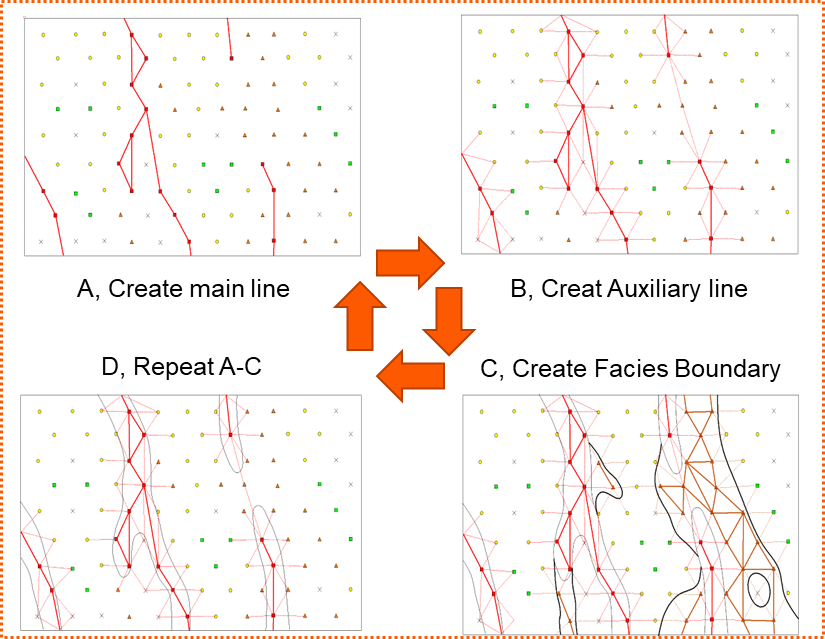
Fig. Intelligent mapping algorithm
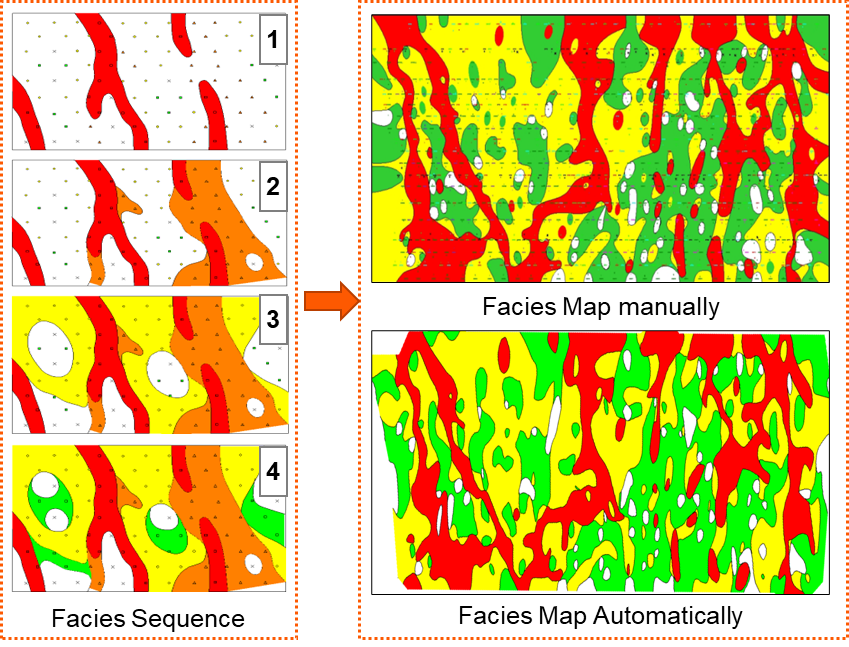
Fig. Facies sequence (left) and comparison between facies result (right)
Steps to perform Facies Interpretation in GES:
· Get facies result for zone from facies log: Go to Data Pane → Click Stratigraphy → Right Click→ Click Property Calculator → Input Property Name (for example, Facies1) for facies → Select Discrete for Type → Select Stratigraphy Scheme → Choose To Zone → Select facies log for Log Name → Select facies attribute you want to analysis → Select Most of Algorithm → Click OK
· Go to Geological Evaluation scenario/Geology & Modeling Scenario → Geology Evaluation → Facies Map
· Select the zone → Select facies result calculated in step 1 → Click Automatic → Set Connection Radium and Source Direction → Choose Boundary → Input facies layer → Click OK
· Or Select the zone → Select facies result calculated in step 1 →Click Manual → Choose Boundary → Input facies layer → Click OK → Click New on the ribbon bar → left click and draw facies block in the window → choose one facies attribute in Facies Fill ribbon bar → click the facies block, the block will be assigned facies attribute