Crossplot Analysis
Crossplot Analysis
Crossplot allows users to plot different data on X and Y axis, and use another data as Z for colorization. In GES, crossplot can be used to create regression lines and perform classification analysis, and can be used to perform fitting analysis, which is to study the relationship between the two parameters.
Two application you can perform in Crossplot Analysis:
1) Generate discrete log. Identify lithology, facies…. Use core data to get the log value range of sandstone, and then use this range to interpret other non-core wells.
2) Analyze the relationship between different parameters, for example, you can get porosity and perm relationship equation of different lithologies or facies.
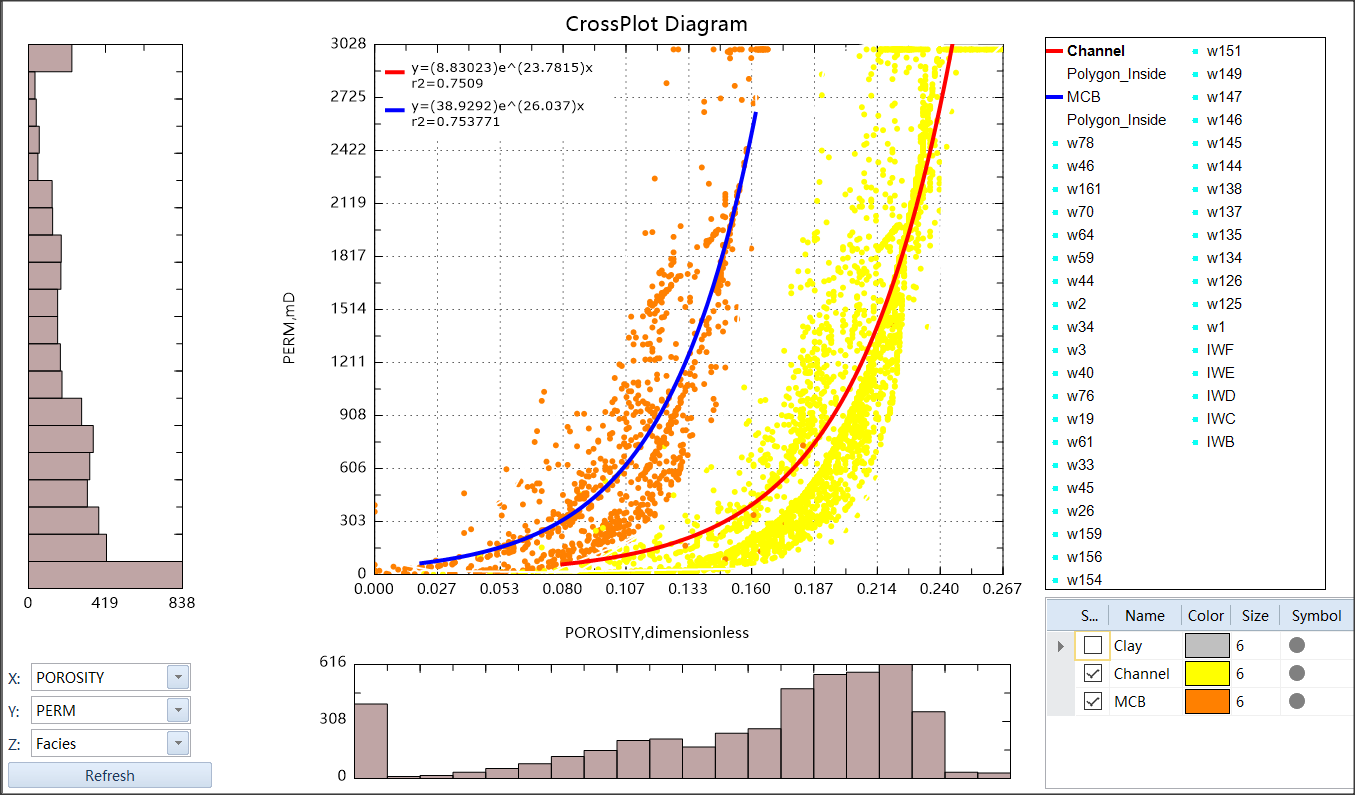
Fig. Example of Fitting analysis in Crossplot
Steps to perform Crossplot Analysis in GES:
· Go to Geological Evaluation Scenario/Geology & Modeling Scenario → Log Analysis → Crossplot Analysis
· Click Add Well → Select Well → Click OK → Choose Stratigraphy Scheme → Choose Top/Bottom Horizon → Set X/Y axis (Well Logs) and Z axis (Discrete Logs) → Click OK
· Application 1: Click Start Analysis → Click Create Classification → Draw a polygon in window → Double Click to finish drawing polygon → enter the name for discrete log → Click Generate Discrete Logs → Select Well → Set depth range and discrete log name → Click OK
· Application 2: Click Inside/Outside Points → Draw a polygon in window → Double Click to finish drawing polygon → Click Fitting Analysis → Choose Fitting Method → Click Run → Click Add Show → Click OK
Message