GES Modules
Log Analysis
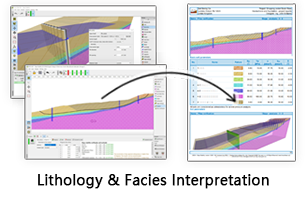
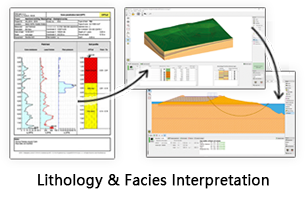
GES Log Analysis module empowers users to process log data, normalize logs, classify facies, and calculate petrophysical properties. Users can load in raw well data and produce reliable properties for 2D geological evaluation and 3D geomodeling.
Raster Log
Raster log module includes depth calibration, image crop, image straighten, add header and lower. The image will be compressed or extended according to the markers.
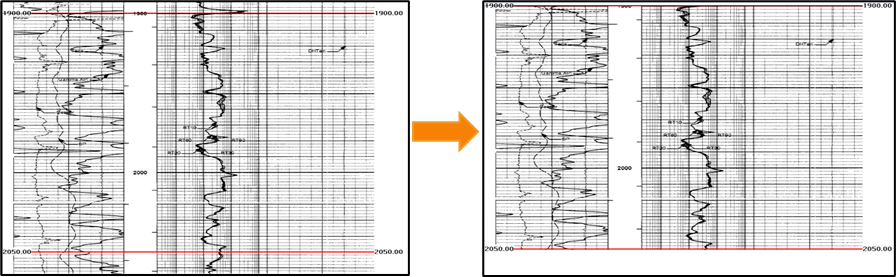
Fig. Crop at depth: before (left) and after (right)
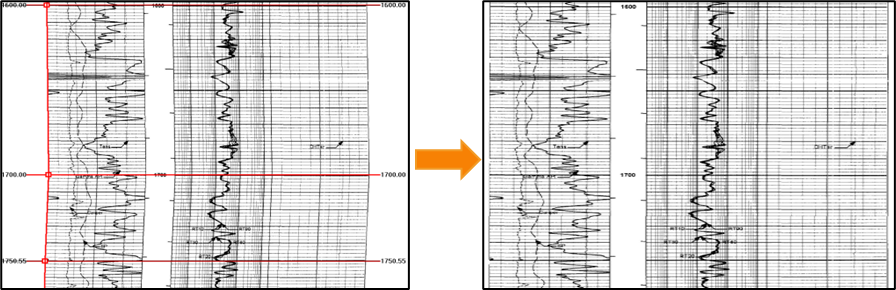
Fig. Straighten the image : before (left) and after (right)
Log digitization also can be performed in Raster Log module. In GES you can digitize log manually or automatically, and you can digitize curve in linear type or in logarithmic type.
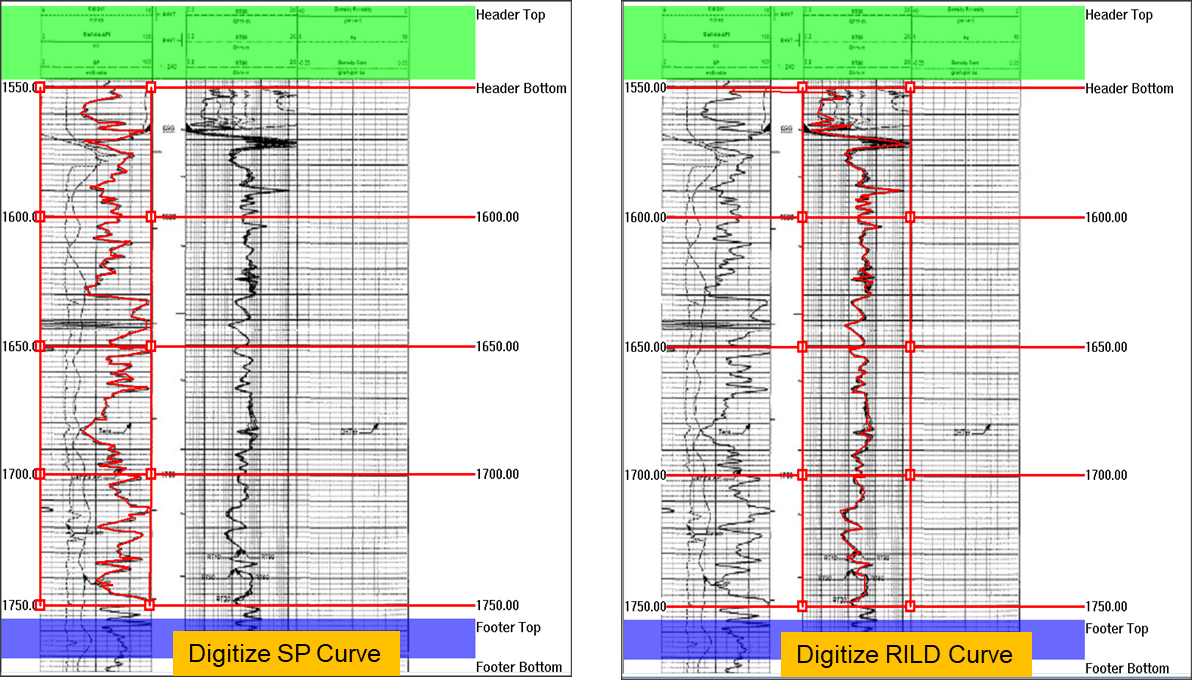
Fig. Log digitization: line type (left) and logarithmic type (right)
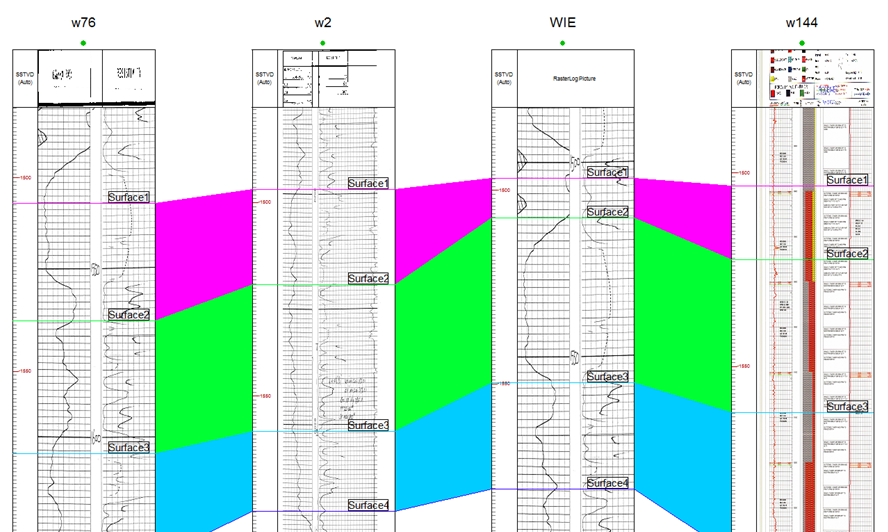
Fig. Raster log application in well correlation
Steps to perform Raster Log in GES:
· Go to Geological Evaluation Scenario/Geology & Modeling Scenario → Log Analysis → Log Digitization
· Select a well → Click OK → Load Image from computer/Project
· Click Depth Settings to set image unit → Click Add Depth to add top and bottom depth → set interpolate
· Add Straight Edge → click along the image edge → Move the square edit point to make sure the straight line are aligned with image edge → Straighten Image
· Click Digitize Logs → Click Settings to set curve name and scale → Add Track Edge (L)/(R) → Click Start → Click in the window to draw curve → Store Curve
Log Processing
Data quality for raw well log data is sometimes problematic. Log data must be edited before it can be applied to calculate petrophysical properties. Log Preprocessing module in GES is designed to make this process much simpler.
There are diverse curve editing tools in GES to meet logging processing requirements, including Move Vertically, Move Horizontally, Baseline Shift, Smooth Curve, Draw Curve, Outlier Processing, Resample and Merge Curve.
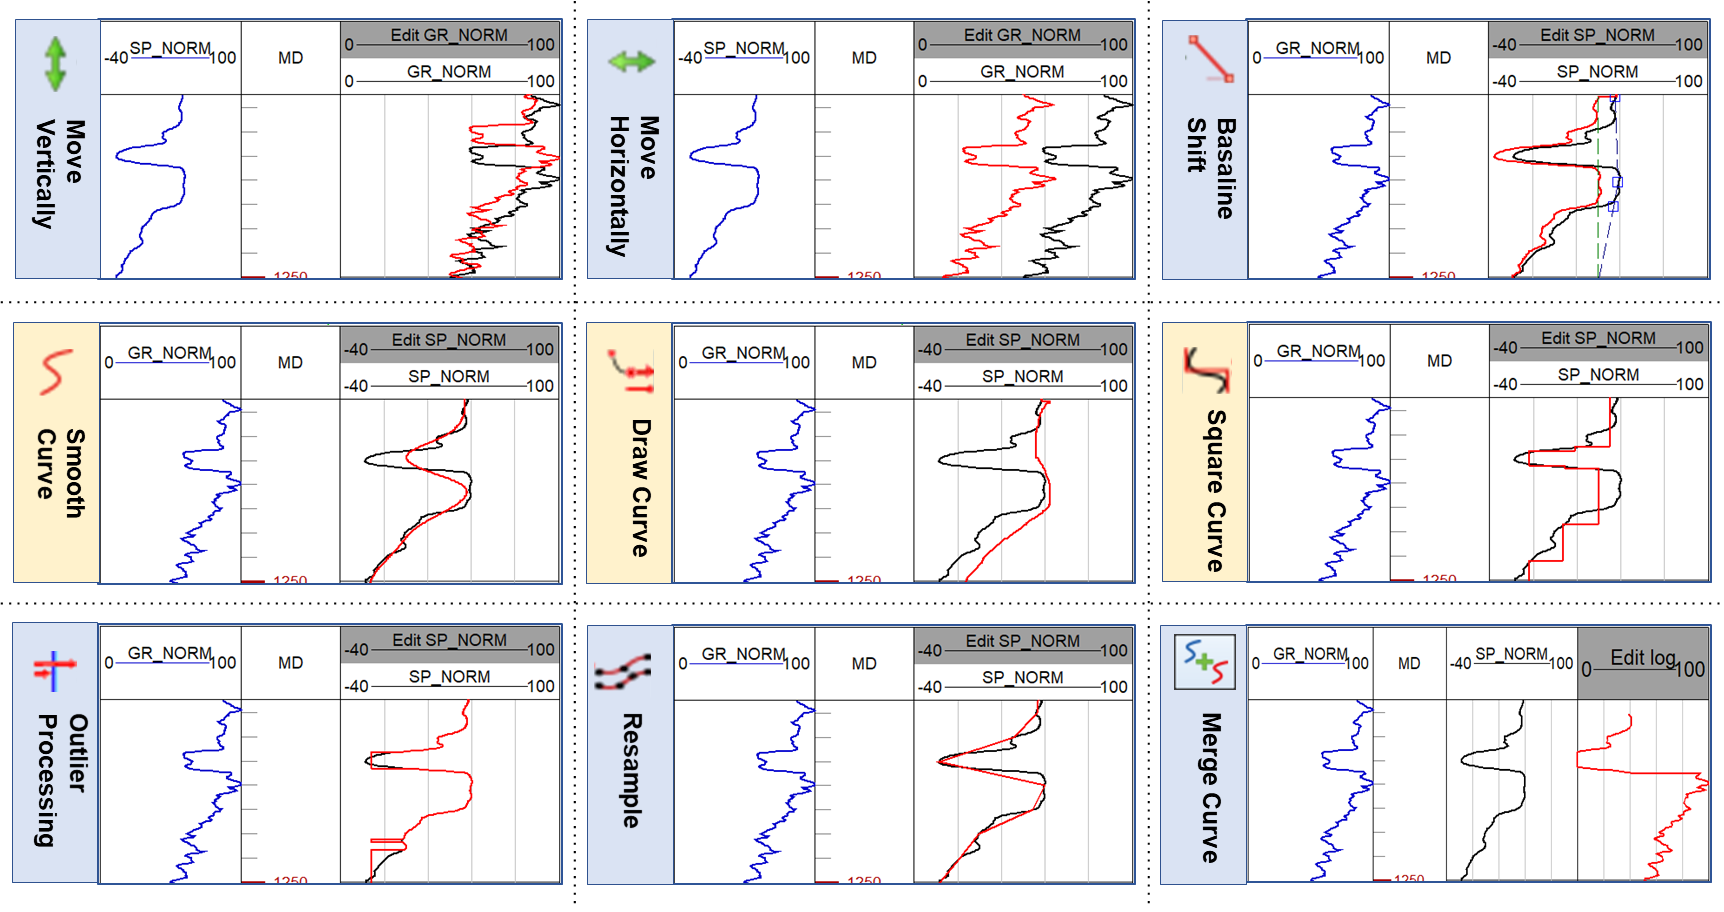
Fig. Infill (left) and fill (right) the model well
Steps to perform Log Processing in GES:
· Go to Geological Evaluation scenario/Geology & Modeling Scenario → Log Analysis → Log Processing
· Select a well → Click OK → Click well column → Right click → Add Well logs track → Set Depth Range → Click OK
· Click Well logs track in window → Go to Property pane → Basic Label → Choose a curve for Data Name
· Click Well logs track in window → Active Modify Curve → Choose Log Processing method → Save Curve
Histogram Correction
Wells are often logged over decades, with different vintages, logging tools, and vendors. In the same well and interval, different logging companies could have different readings on a certain property. Normalization is therefore critical to position logs onto the same baseline. Only after normalization a geoscientist can apply universal parameters to all wells for petrophysical property calculation. In GES, the normalization tool is embedded in Histogram.
Two methods can be selected when normalizing curves: Single Points and Two Points.
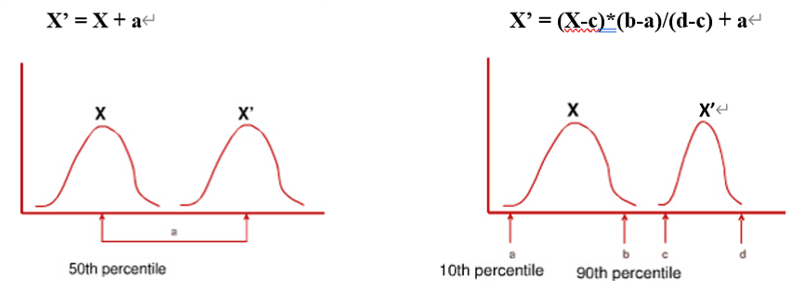
Fig. Single Point Method Fig. Two Point Method
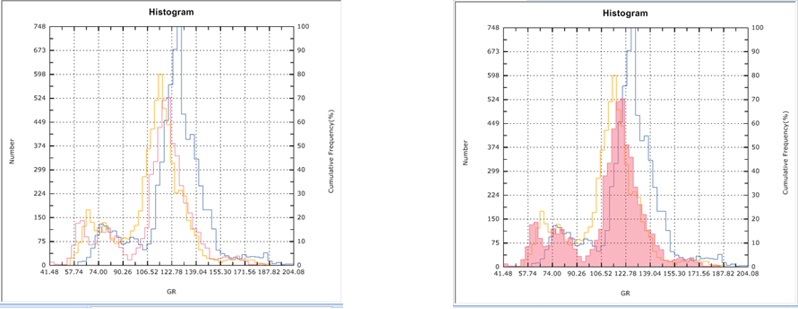
Fig. Infill(left) and fill(right) the model well
Steps to perform Histogram Correction in GES:
· Go to Geological Evaluation Scenario/Geology & Modeling Scenario → Log Analysis → Histogram Correction
· Click Add Well → Select Well → Click OK → Choose Log Name → Choose Stratigraphy Scheme → Choose Top/Bottom Horizon → Choose Model Well → Click OK
· Click Axis to set X/Y axis and histogram header
· Click Normalize → Select method → Click OK
· Click Fill Model Well → Save Curve
Crossplot Analysis
Crossplot allows users to plot different data on X and Y axis, and use another data as Z for colorization. In GES, crossplot can be used to create regression lines and perform classification analysis, and can be used to perform fitting analysis, which is to study the relationship between the two parameters.
Two application you can perform in Crossplot Analysis:
1) Generate discrete log. Identify lithology, facies…. Use core data to get the log value range of sandstone, and then use this range to interpret other non-core wells.
2) Analyze the relationship between different parameters, for example, you can get porosity and perm relationship equation of different lithologies or facies.
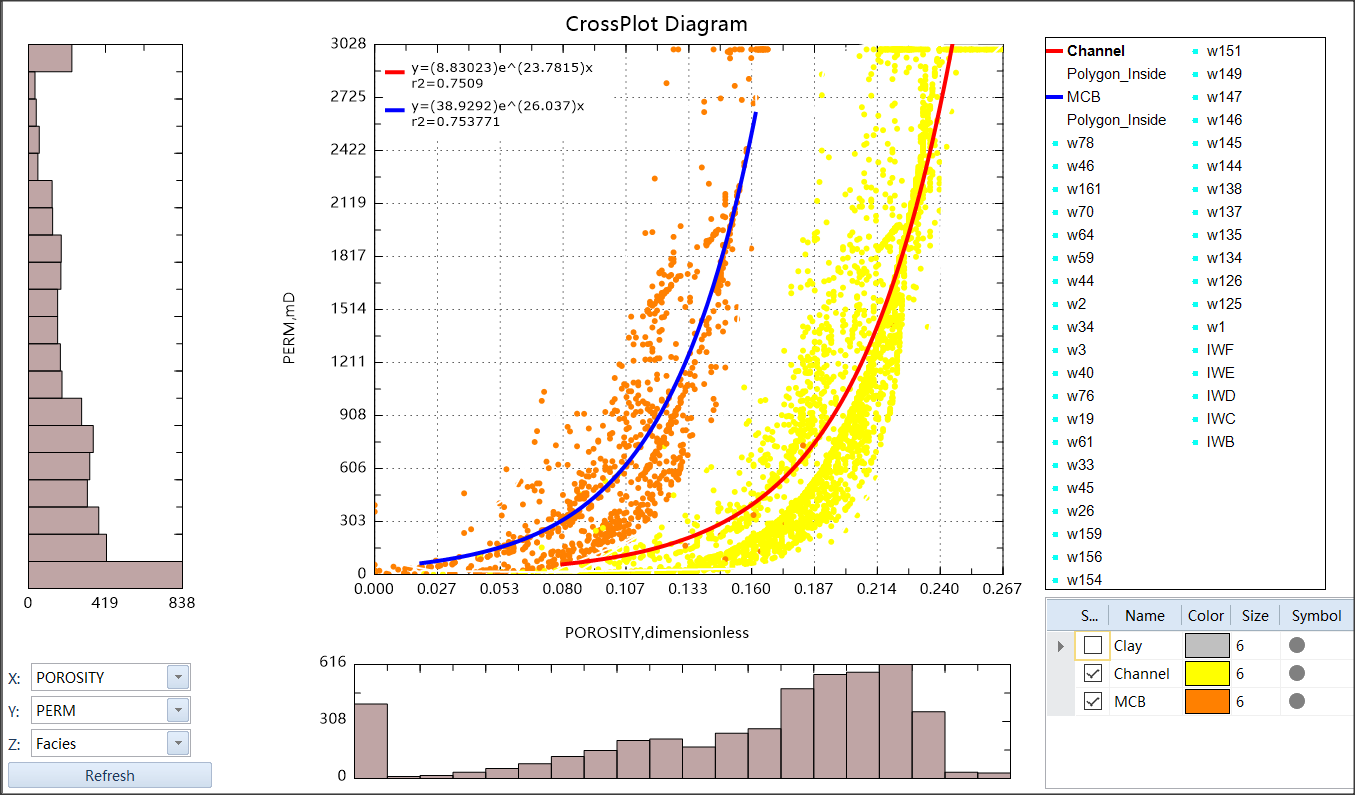
Fig. Example of Fitting analysis in Crossplot
Steps to perform Crossplot Analysis in GES:
· Go to Geological Evaluation Scenario/Geology & Modeling Scenario → Log Analysis → Crossplot Analysis
· Click Add Well → Select Well → Click OK → Choose Stratigraphy Scheme → Choose Top/Bottom Horizon → Set X/Y axis (Well Logs) and Z axis (Discrete Logs) → Click OK
· Application 1: Click Start Analysis → Click Create Classification → Draw a polygon in window → Double Click to finish drawing polygon → enter the name for discrete log → Click Generate Discrete Logs → Select Well → Set depth range and discrete log name → Click OK
· Application 2: Click Inside/Outside Points → Draw a polygon in window → Double Click to finish drawing polygon → Click Fitting Analysis → Choose Fitting Method → Click Run → Click Add Show → Click OK
Log Calculation
GES provides abundant equations to calculate various petrophysical properties, such as Vsh, porosity, permeability and water saturation. Individual equations can be accessed in Log Analysis tab, and you can also create a formula according to your needs by using the log calculator.
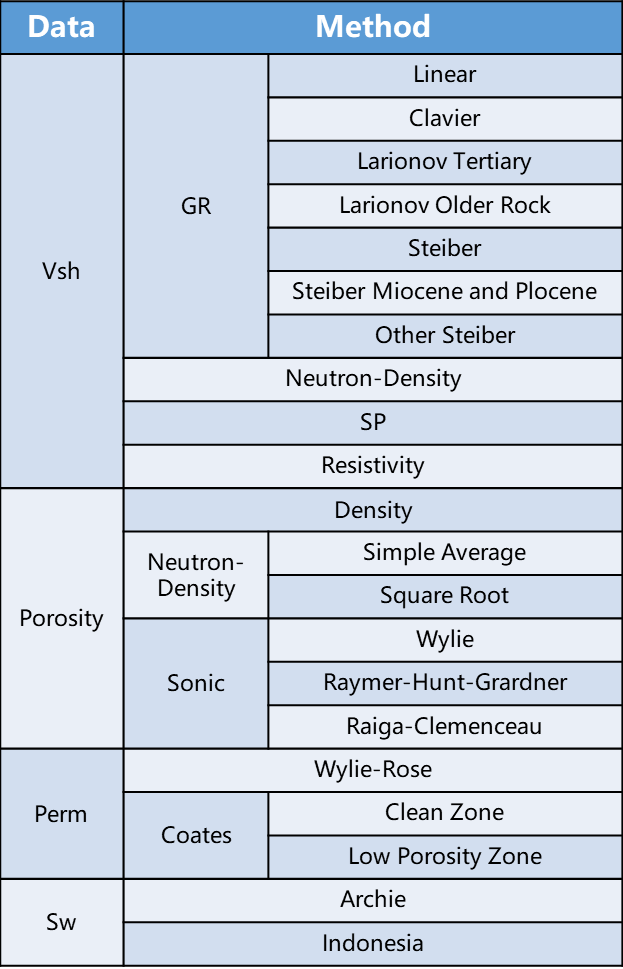
Fig. Formulas in GES
Steps to perform Log Calculation in GES:
· Go to Geological Evaluation scenario/Geology & Modeling Scenario → Log Analysis → Log Calculation
· Click the down arrow of VSH/Porosity/Perm/SW → Select a method and click → Select Well Name → Click the method name under workflow in left window → Choose input curve, set parameter and enter output curve name in right window → Click Run in left window