Isochore Map
Isochore Map
Stratum isochore maps are contour maps drawn by stratum thickness. Through isochore map, researchers can know stratigraphy distribution and stratum thickness change, so as to help researchers know better structure and provenance direction.
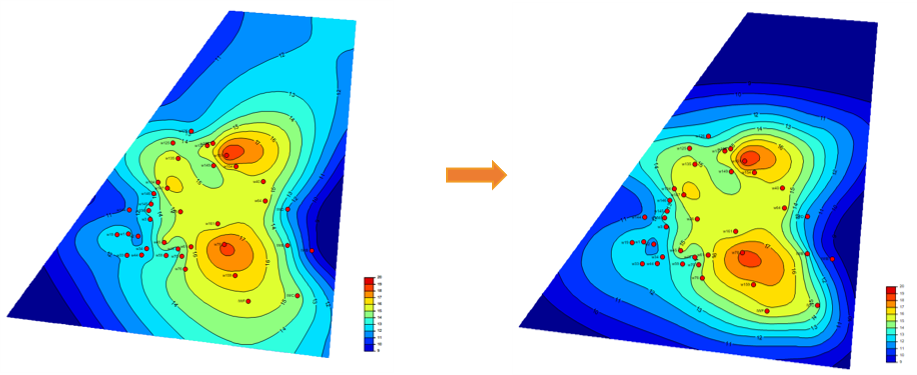
Fig. Isochore map: no constraint (left) and using control line(right)
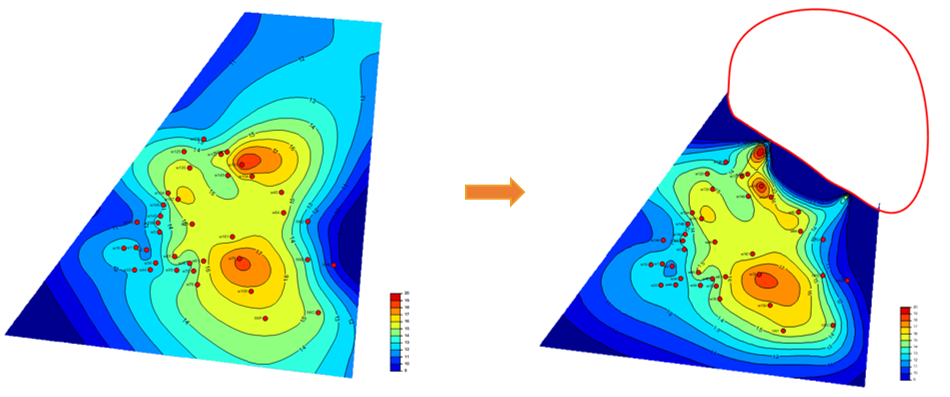
Fig. Isochore map: no constraint (left) and using unconformity line(right)
Steps to perform Isochore Map in GES:
· Go to Geological Evaluation scenario/Geology & Modeling Scenario → Geology Evaluation → Isochore Map
· Select Input data, Constrain and Boundary, enter the Output name in Common label
· Set Grid Increment → Select Algorithm in Mapping Settings Label
· Go to Visual Settings label, click Estimate button, Min and Max value will be automatically generated, you can also input the value manually
· Set Interval and click Apply
· Choose the template for Color table
· Set Contour Line Nodes, normally set to 2 → Click OK
· Go to Scene pane, click Isochore, the contour ribbon bar will be shown, and you can edit contour line and fill in this ribbon bar
Message